Search the Community
Showing results for tags 'OBD II'.
Found 7 results
-
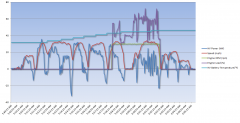
I recorded some OBD II sensor data from the HVB for my 67 mile commute home today. The interval between each data point is five seconds. The commute took about 70 minutes. The positive values represent current flow out of the HVB. Negative values are current flow into the battery, e.g. regenerative braking. You can see the current ranged from -112 to 139 amps.
-
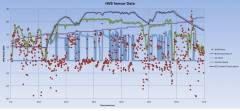
The following plot shows the preferred operating regions for the ICE for a recent trip obtained driving on highways by recording OBD II data from the car. The x-axis is engine RPMs. The y-axis is Absolute Load (Volumetric Efficiency), i.e. the percentage of maximum airflow into the engine. Absolute Load is linearly correlated with brake torque (force) of the engine. Engine power is then proportional to torque x RPMs. One would expect the car to operate in the regions where it is most efficient. While the ICE is warming up, it operates at a constant 1500 rpm. Only the load varies. The electric motor makes up any difference in required power. At highway speeds, it likes to operate at around 2000 rpm and vary the load between 45% and 75% as needed to supply the required power. The ICE runs the generator at times which increases the load on the engine. Only when power demand is very high (for example accelerating to pass), does the engine speed exceed 2300 rpm. The results may be different for city driving. It would be nice to also show normalized fuel consumption at each operating point (such a map for a Prius can be found here: "http://fordfusionhybridforum.com/topic/6775-what-is-an-ecvt-how-does-it-work-here-is-the-answer/?p=74047"). But that would require a lot of data. The OBD II measurements are not synchronized. There may be more than a second difference in time between when each of the measurements (rpms, load, fuel rate) are taken. A lot can happen in one second. This following chart has errors due to this issue.
-

From the album: Car
Engine map showing the operating regions of the ICE. The x-axis is Engine RPMs. The y-axis is absolute load, the percentage of maximum air flow into the engine which is linearly correlated with brake torque. The solid black line estimates the maximum load at a given RPM. -

Engine Map, Engine RPM vs. Absolute Load (Volumetric Efficiency)
larryh posted a gallery image in Member's Album

From the album: Car
Engine map showing the operating regions of the ICE. The x-axis is Engine RPMs. The y-axis is absolute load, or volumetric efficiency, i.e. the percentage of maximum air flow into the engine. -
From the album: Car
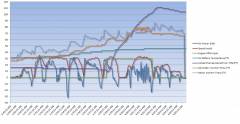
This is my 8 mile commute at -12 F showing various sensor temperatures. -
From the album: Car
OBD II data for 8 mile commute to work at -12 F. -
From the album: Car
HVB sensor data for a 60 mile commute.
