Search the Community
Showing results for tags 'hvb'.
Found 16 results
-
Hello, I bought a used 2013 Ford Fusion Energi with 110k miles. Straight off the bat facing following issues with the hvb charging (which is not charging when plugged in) I tried plugging it in both 120v and 240v chargers but no avail. When connecting to the charger, the ring circles clockwise and then no light at all in the ring. a. The charger is only showing Power light, NO VEHICLE, OUTLET CHECK, OR FAULT LIGHT ONS OR BLINKS. All these lights remain off on the charger. b. The odometer shows a yellow indicator that it is plugged in and charging. c. The Ford Sync screen shows 0% charge and no charging status even whether it is connected or charging or any faults, when i connect to the charger. And after overnight charge as well, still 0%. d. The car is driving fine, as far as the hybrid battery charging and usage goes, both in the city and on the highway and roughly getting 20 EV miles to every 100 miles I am driving. I drove it on 1100 miles trip and it drove fine in terms of hybrid battery (mode). e. I reset the Ford Sync to factory setting and installed My Ford Mobile app and have registered the car on the app, it locks, unlocks and the engine starts perfectly, and there are no error codes whatsoever so far. Kindly if anyone can guide me if I am missing anything or any step I am doing incorrectly, or if anyone had the similar problem with their Fusion energies would like to share their experiences. Thank you in advance.
-
see next post
-
The following chart shows the degradation rates for an NCA Lithium-ion battery stored at a constant SOC and temperature (http://www.nrel.gov/transportation/energystorage/pdfs/53817.pdf). A description of the different types of Lithium-ion batteries can be found at the following link: http://www.batteryuniversity.com/learn/article/types_of_lithium_ion. This is the type of battery used in the Tesla Model S (http://batteryuniversity.com/learn/article/bu_808b_what_causes_li_ion_to_die). The type used in the Energi, Volt, and LEAF is NMC/Lithium Manganese Oxide (http://articles.sae.org/11705/). I suspect that the Energi HVB has higher degradation rates than NCA, but the degradation rates should be comparable. The top chart shows resistance growth which correlates with power loss. A 20% increase in resistance results in a 17% power output loss from the HVB. The bottom chart shows capacity fade rate which correlates with capacity loss. As an example how to read the bottom chart, consider a battery stored at 25 C and 100% SOC. The capacity fade rate from the chart is -4.7e-3/sqrt(day). To determine the time to 20% capacity loss, we compute (0.2/4.7e-3)^2 = 1810 days = 5 years. If you wish to compute the capacity degradation for a battery stored for one year (365 days) at 100% SOC and 30 C, look at the 100% SOC line in the bottom graph where it intersects a vertical line drawn through 30 C on the x-axis. This occurs at -5.2e-3/sqrt(day) fade rate on the y-axis. The degradation is then sqrt(365)*5.2e-3 = 10%. The dashed horizontal lines indicate the lifetimes for 20% capacity loss or resistance growth. For example, consider capacity loss. The 10 year line crosses the 80% SOC line at about 27 C in the bottom chart. That means the battery capacity loss will be 20% after 10 years if the battery is stored at 80% SOC and 27 C. The point on the 80% SOC line corresponding to 20 C is above the 10 year capacity loss line. That means that degradation of the battery will less than 20% after 10 years if stored at 80% SOC and 20 C. Based on the charts below, if you store the battery at 50% SOC for 10 years, the power loss and capacity loss should be less than 20% for HVB temperatures up to 35 C, or 95 F. The normal recommended SOC for storing Lithium-ion batteries is between 30% and 40%. If you store the battery at 30% SOC for ten years, degradation should be less than 20% for HVB temperatures up to 45 C, or 113 F. To minimize degradation, ideally you would want to store the battery at 0% SOC. But that is not recommended, especially for batteries that are connected to devices. Should the cell voltage fall below 3.0 V, the battery will be irreparably damaged. That can happen if the car draws too much power from the HVB when the SOC falls below 0%. So I would not want to drain the HVB to 0% SOC. Note that when MFT/MFM reports 0% SOC of the HVB, the actual SOC is about 20%. So you need to take that into account when using the SOC reported by MFT/MFM.
- 27 replies
-
- 1
-

-
- HVB
- Degradation
- (and 1 more)
-
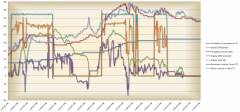
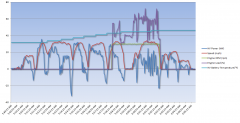
I recorded some OBD II sensor data from the HVB for my 67 mile commute home today. The interval between each data point is five seconds. The commute took about 70 minutes. The positive values represent current flow out of the HVB. Negative values are current flow into the battery, e.g. regenerative braking. You can see the current ranged from -112 to 139 amps.
-
The following posts describe an experiment I performed the other day with the car to understand the forces and their effect on the motion of an EV. For the first part of the experiment, I drove the car with cruise control set to various speeds along the same section of road and measured the electrical input power and mechanical output power of the motor required to maintain constant speed. This allowed me to plot the power required to overcome friction (aerodynamic drag, tire rolling resistance, and internal frictions) as a function of speed. Next I did a coast down on the same section of road. With the car in neutral, I recorded time vs. speed as the car slowed down. I also recorded the power output of the motor. The power output of the motor is negative during coast down. Internal friction inside the motor is slowing the car down. The outside temperature was 63 F. There was no wind. The road that I am using is level to within 1.5 feet. I drove the car for approximately 20 miles, with the ICE running, prior to the experiment. I wanted to make sure the car was thoroughly warmed up before starting. The temperature of the drivetrain components in a car have a huge impact on the internal friction within the car. When cold, the car will require significantly much more energy to maintain constant speed. As the car warms up, each time I repeated a portion of the experiment, I would get very different results.
-

From the album: Car
Efficiency of electric motor at 6750 rpm (about 48 mph). The chart shows the mechanical output power of the motor vs. the electrical input power. -

HVB Energy Consumed vs. Distance for Various Accelerations
larryh posted a gallery image in Member's Album

From the album: Car
This charge shows the HVB Energy Consumed vs. Distance for acceleration rates of about 1.5 bars, 2 bars, and 3 bars. -

From the album: Car
The following plot shows the power to the HVB vs. Speed for a 60 mile commute when the ICE is on. Negative power means the HVB is charging. During most of the trip, the HVB is being charged when the ICE is on. -

From the album: Car
OBD II data from a short drive at -10 F. -

From the album: Car
The graph shows the maximum power that can be provided by the HVB vs. HVB Temperature. -
From the album: Car
This graph shows an 8 mile trip that involves a couple of relatively steep 15% grades. Outside temperature is 3 F. -
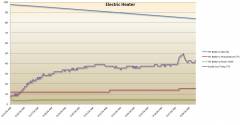
Electric Heater Performance for Ambient Temperature of 3 F
larryh posted a gallery image in Member's Album
From the album: Car
This chart shows the performance of the Electric Heater with an ambient temperature of 3 F. The car is plugged into the 120 V charger and turned on (EV Now mode) with climate control enabled. -
From the album: Car
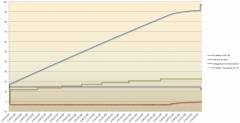
The SOC, temperature, and power applied to the HVB when charging using a 240 V charger. Also shown is the 12 V battery voltage. -
From the album: Car
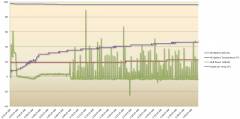
This chart shows the HVB temperature, cabin temperature, HVB SOC and power flow into HVB while preconditioning when ambient temperature is 3 F. -
From the album: Car
OBD II data for 8 mile commute to work at -12 F. -
From the album: Car
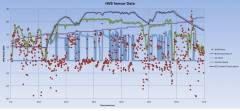
HVB sensor data for a 60 mile commute.